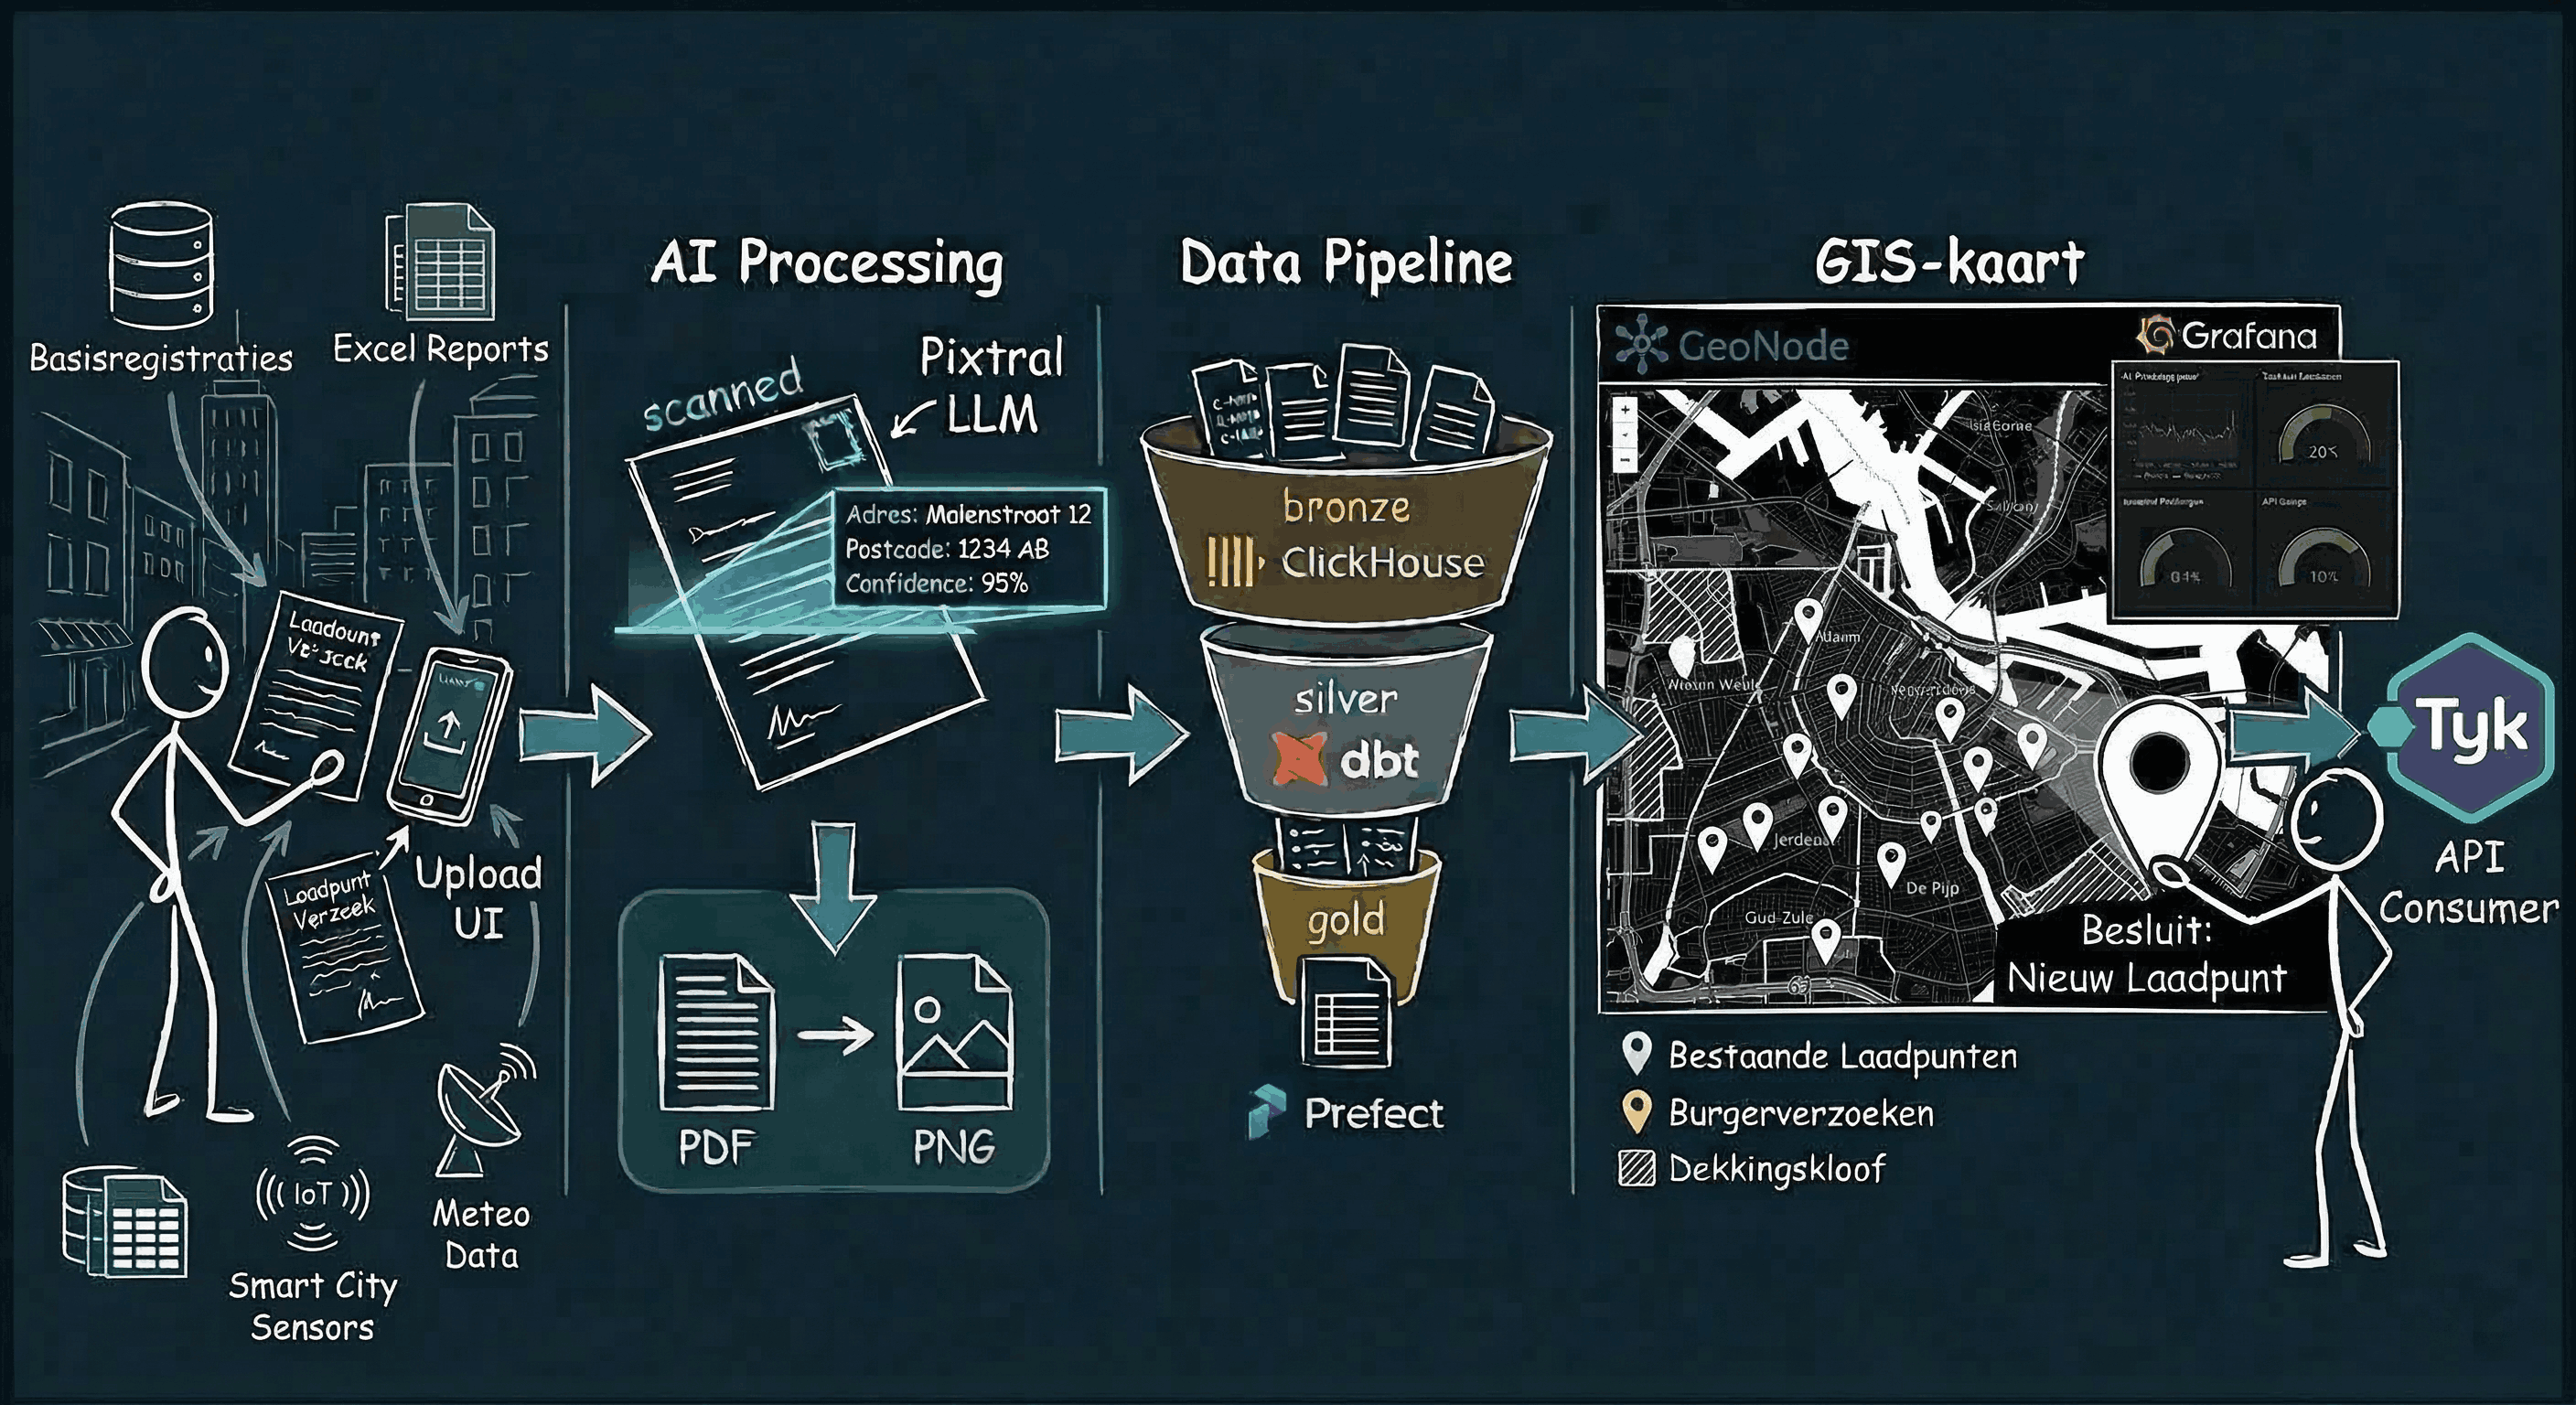
Demo Walkthrough

Scroll through the complete platform workflow — from citizen letter upload to geospatial analysis.

The Use Case

A municipality wants to know where to place new EV charging stations. Citizens can submit requests via handwritten letters, a web form, or a phone call. Each request is processed by AI to extract the address, geocoded to exact coordinates, stored in a multi-layer data warehouse, and visualized on interactive maps — all using fully sovereign, open-source tooling with zero cloud lock-in.

This demo uses real data from CBS (Statistics Netherlands) for the municipality of Zoetermeer, retrieved via their open API. The same approach can be applied to any Dutch municipality.

Scroll to begin
Step 01 — Data Ingestion

Letter Upload

A citizen uploads a handwritten or typed letter requesting an EV charging point through a simple drag-and-drop frontend. Metadata such as name, district, and address are filled in.

FastAPI FastAPI Upload Portal
Upload Portal
Step 02 — Object Storage

File Storage in RustFS

The uploaded letter file is stored in RustFS, a self-hosted S3-compatible object store. Files are organized by upload date and can be browsed through the RustFS web console. This ensures all raw documents are preserved alongside the platform with no external cloud dependency.

RustFS RustFS
RustFS Storage
Step 03 — AI Processing

File Conversion & LLM Extraction

If the upload is a PDF, it's first converted to PNG via a Python script. The image is then sent to Mistral's open-source vision LLM "Pixtral" hosted on Scaleway, which reads the handwritten text and extracts the address as structured JSON.

Pixtral Pixtral (Scaleway)
LLM Extraction
Step 04 — Location Enrichment

Geocoding

The extracted address JSON is sent to a self-hosted Nominatim container — an open-source geocoder based on OpenStreetMap — which enriches it with precise longitude and latitude coordinates within the municipality.

Nominatim Nominatim
Nominatim Geocoding
Step 05 — Data Warehouse

Landing in ClickHouse

All results (letters, web and phone requests) land in ClickHouse following a multi-layer model: bronze (raw data + metadata), silver (cleaned and combined across channels), and gold (final analytics-ready tables with dimensions, facts, and marts).

ClickHouse ClickHouse
ClickHouse Bronze
Step 06 — Pipeline Orchestration

Prefect Orchestration

Prefect orchestrates the entire pipeline — from upload processing, LLM extraction, and geocoding to loading into ClickHouse and running data quality checks. A scheduled "poll pending letters" flow checks every few minutes for unprocessed letters.

Prefect Prefect
Prefect Dashboard
Step 07 — Data Quality

dbt Transformation & Quality

Data tests (postal code ranges, coordinate bounds, not-null checks) are defined in dbt. The dbt docs site visualizes the full lineage from bronze through silver to gold, showing table schemas and which tests apply to each model.

dbt dbt
dbt Docs
Step 08 — API Access

Authenticated REST API

A FastAPI application with Swagger documentation exposes endpoints for uploading letters, retrieving GIS results, and querying analytics. Access requires a time-limited API key generated through the admin portal, routed through the Tyk API gateway.

Tyk Tyk + FastAPI
Swagger API
Step 09 — Observability

Grafana Monitoring

Five Grafana dashboards monitor the platform: API request rates and latency, geocoding success rates, average LLM extraction time, token usage, confidence scores, upload volumes over time, and uptime checks every 20 seconds.

Grafana Grafana + Prometheus
Grafana Dashboard
Step 10 — Geospatial

GIS Services & Visualization

GeoServer publishes geospatial layers: CBS neighbourhood boundaries, existing charging points, requests per neighbourhood, and proximity analysis results. These can be downloaded in various formats or connected directly to ArcGIS or QGIS. GeoNode provides a portal for sharing these GIS resources.

GeoServer GeoServer + GeoNode + PostGIS
GeoNode
Step 11 — Visual ETL

Apache Hop (Optional ETL)

As a successor to Pentaho, Apache Hop offers a visual, point-and-click way to build additional pipelines on top of the bronze tables — especially useful for users familiar with Pentaho who prefer a graphical interface over code.

Hop Apache Hop
Apache Hop

The Complete Pipeline

1 Upload Upload
2 Storage Storage
3 LLM
4 Geocoding
5 ClickHouse ClickHouse
6 Prefect Prefect
7 dbt dbt
8 API API
9 Grafana Grafana
10 GIS GIS
11 Hop Hop
View Full Architecture →